The Statistics feature in the Board Portal gives administrators and board secretaries a complete overview of how the platform is being used. It provides insights into user activity, document engagement, meeting management, and interactive features like polls and questionnaires ⚡.
This global dashboard helps you track adoption, ensure compliance, and improve the efficiency of your board processes.
☝ What Data Is Available?
Within the Board Portal, statistics cover several key areas:
? Users
- Number of active and inactive users
- Frequency of logins
- Engagement levels across board members
? Documents
- Total documents uploaded and shared
- Access and consultation rates
- Distribution by type (e.g., board packs, supporting material)
? Meetings
- Number of meetings created and managed
- Attendance rates
- Overall scheduling efficiency
? % of Activity
- Overall activity levels in the platform
- Comparisons over time (e.g., last quarter vs current quarter)
- Highlights of usage peaks around meetings
? Miscellaneous (Engagement Tools)
- Sent notifications – volume and response rate
- Polls – participation and outcomes
- Questionnaires – number sent, completion rates
✍ How to Access Statistics
- From the main navigation menu, select Analytics.
- Choose the filters or timeframe you want to review (e.g., by quarter, by user group).
- View the results in charts and tables directly in the dashboard.
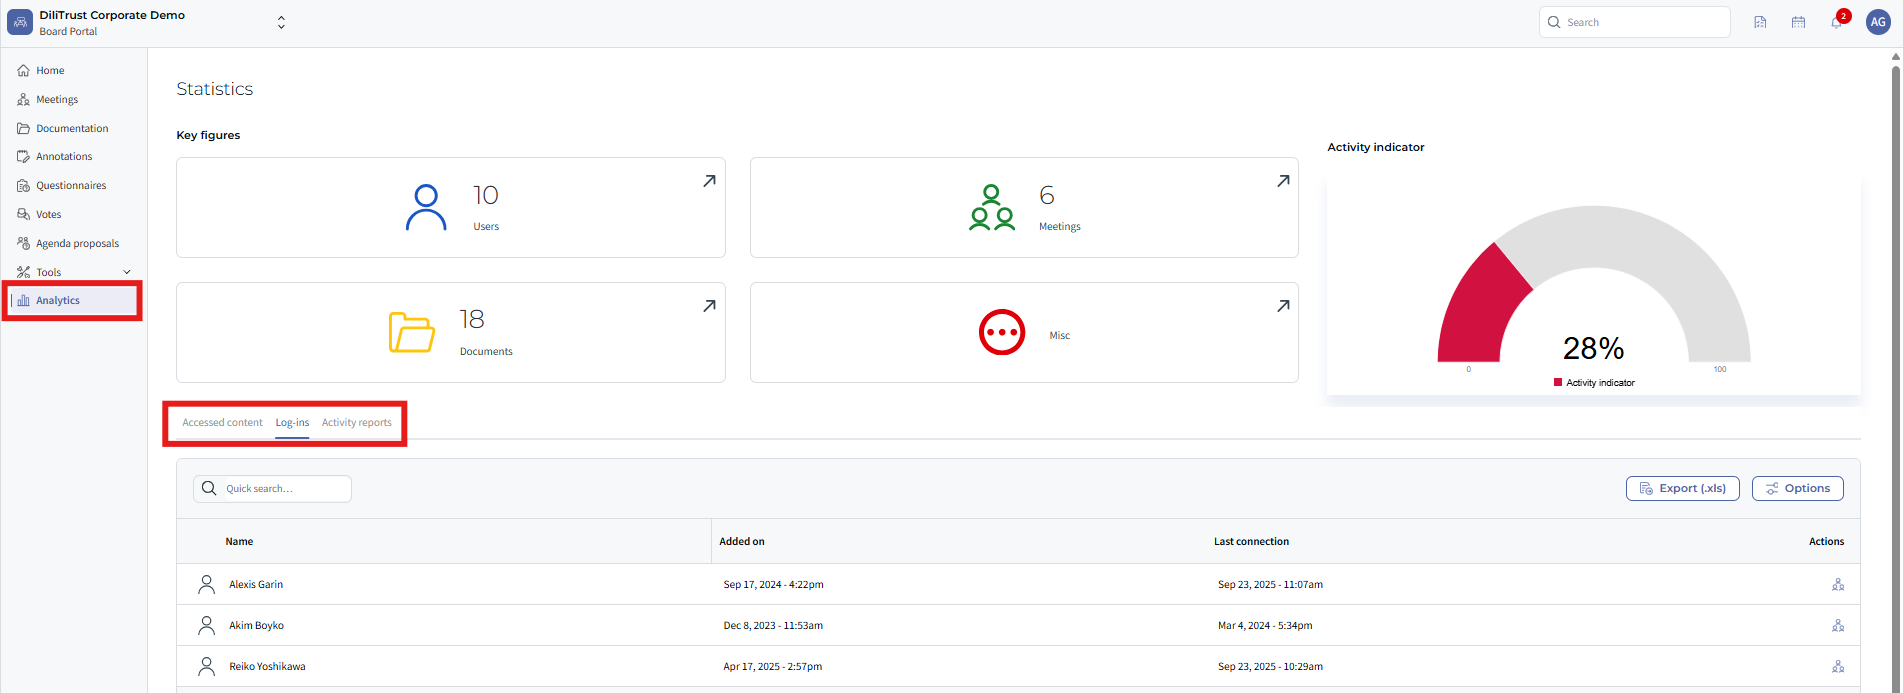
✅ The data is aggregated across the entire module and updates automatically.
⭐ Why Use Statistics?
Statistics in the Board Portal help you:
- ⭐ Monitor adoption of the platform by your board members
- ✍ Ensure documents are being accessed and reviewed in time for meetings
- ⚖️ Confirm compliance with governance processes
- ✊ Measure engagement in pol
Was this article helpful?
That’s Great!
Thank you for your feedback
Sorry! We couldn't be helpful
Thank you for your feedback
Feedback sent
We appreciate your effort and will try to fix the article